Urban Transport Makes Life Unhappy

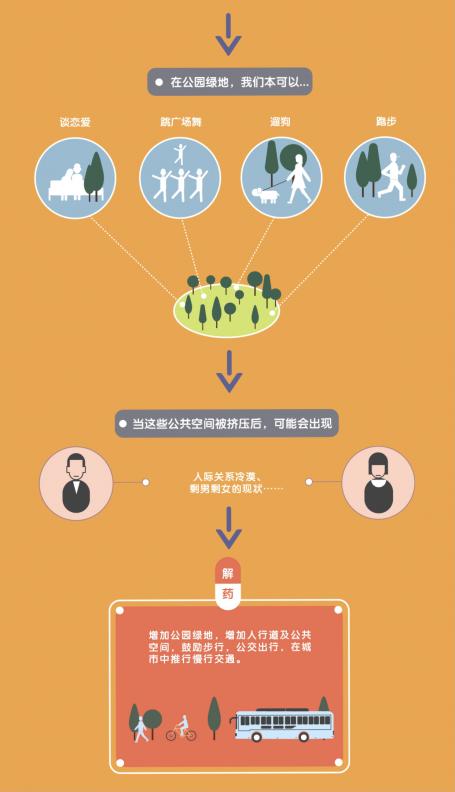
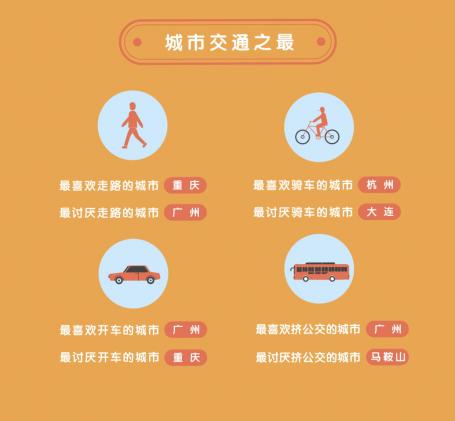
Transport matters. We all have our say about how it should be. For some, cars are the best because they mean freedom; for some, public transport tops all. There are those who believe we would all be better off if cycling regains its popularity. What on earth do we know about transport in our cities? Can we draw a picture about it with the scientific tool-data?
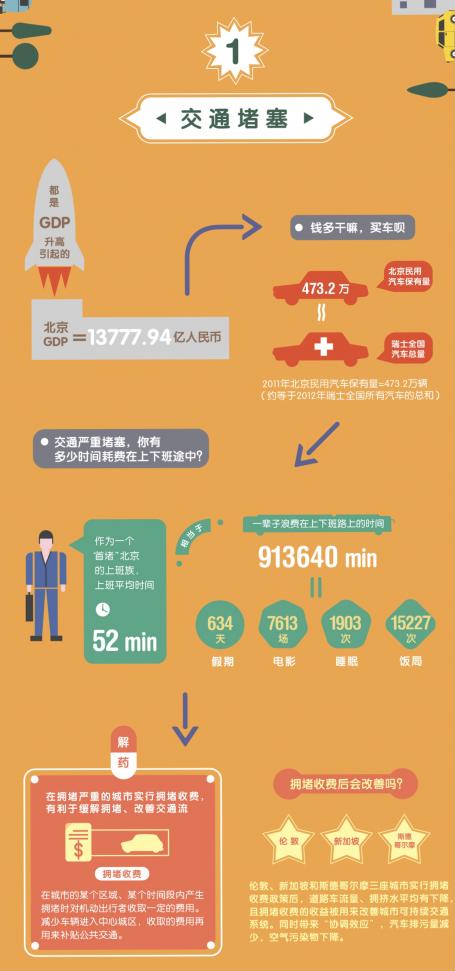
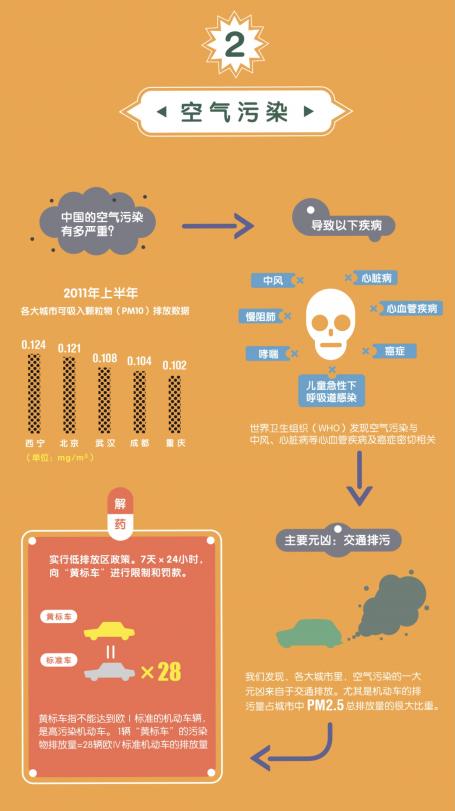
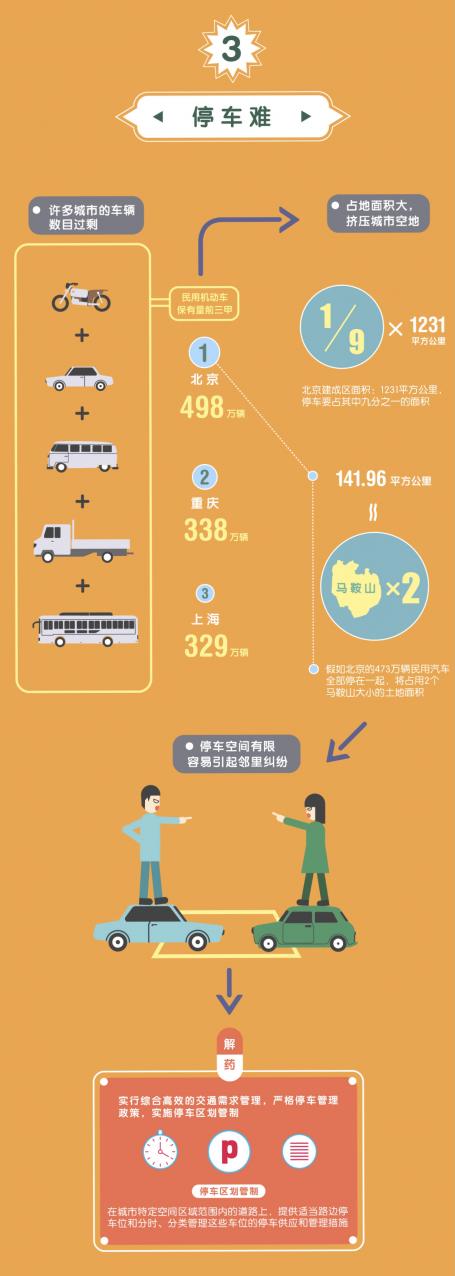
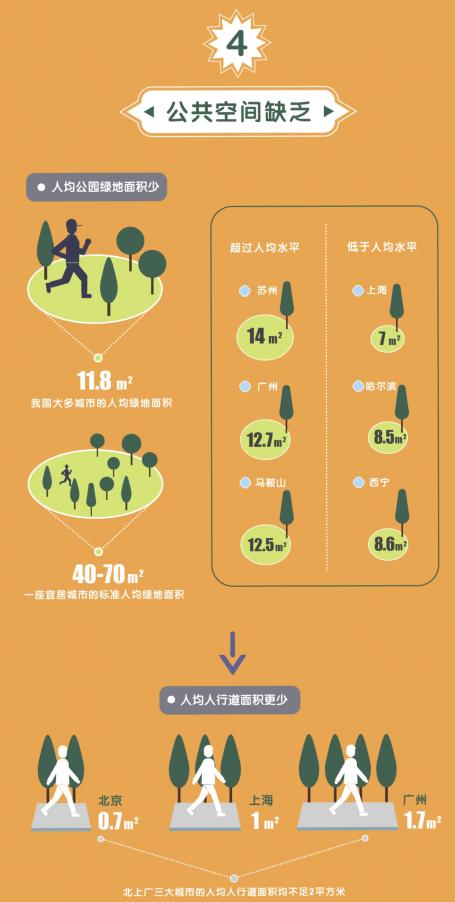
World Resources Institute (WRI), together with other organizations and media including The Paper and SustainableCity on WeChat, analyzed urban transport data, and proposed strategic ideas that are custom-made for solving the most encountered problems of urban mobility. We present our work through data visualization so the public can easily see the challenges of sustainable urban development where transport problems root, and the transport demand management policies that are set to address the problems.